Looking for investment?
Our £16m Arts & Culture Impact Fund provides affordable repayable finance for socially driven arts, culture and heritage organisations registered and operating in the UK.

Our £16m Arts & Culture Impact Fund provides affordable repayable finance for socially driven arts, culture and heritage organisations registered and operating in the UK.
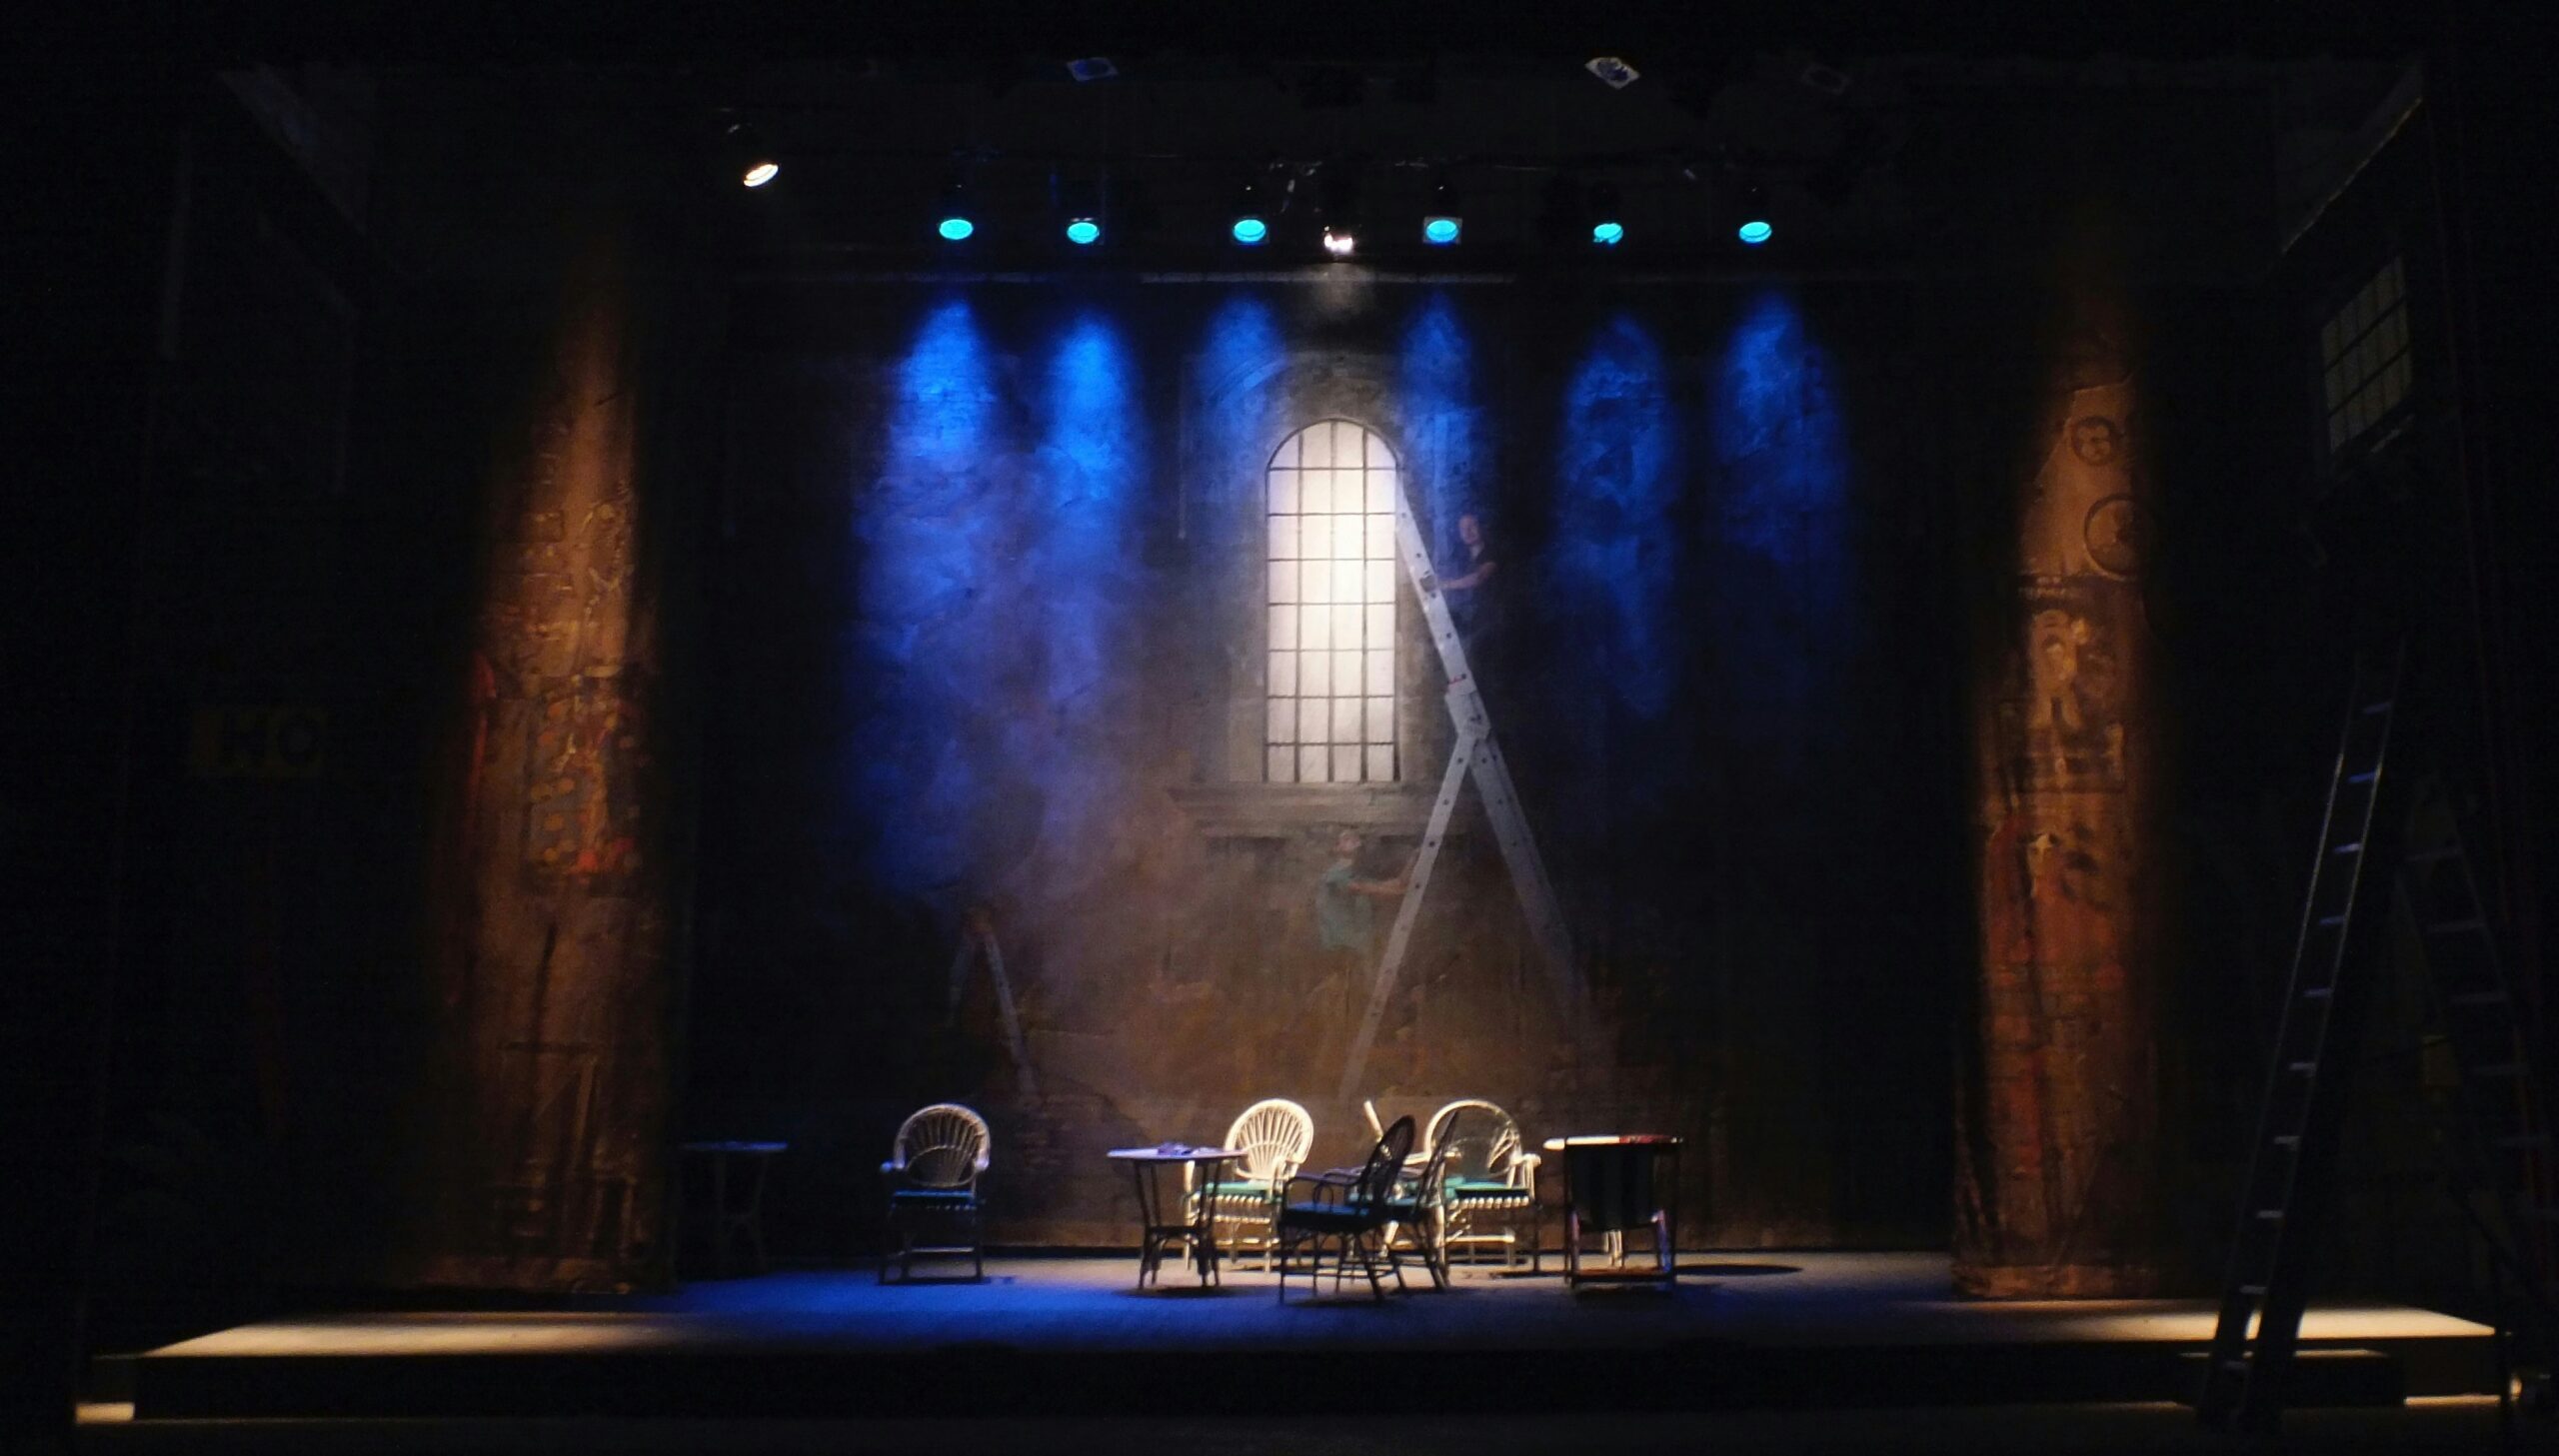
Image credits:
Photo by Stefano Stacchini, courtesy of Unsplash.
Following earlier posts on financial resilience and how our investment has been used, we wanted to look squarely at what our money has pulled in alongside it.
‘Leverage’ is an oft-used concept in the world of investment, but it is also one of the slipperiest and highly contextual. Even within a particular usage, it can be calculated in different ways, producing different metrics of success and very different impressions of what has actually been achieved.
This is the third in a short series of posts drawing on the data from our portfolio of investments across the Arts Impact Fund (AIF), Cultural Impact Development Fund (CIDF) and Arts & Culture Impact Fund (ACIF). Following earlier posts on financial resilience and how our investment has been used, we wanted to look squarely at what our money has pulled in alongside it.*
Before any numbers, we want to be clear on what we mean. In our context, ‘leverage’ is sometimes used to mean the total size of a funding round divided by one’s own contribution. By that definition, every co-investment counts. Put £200,000 into a £2m capital project and you have ‘leveraged’ £1.8m of other money – regardless of whether the project would have happened anyway. Looking at it this way, we have made nearly £19m worth of loans since 2015, which were part of funding rounds totalling more than £78m, meaning that £1 of our capital sits alongside £3.15 of other funding.
However, the harder, more telling question is the catalytic one: would the project have gone ahead, in something like its actual form, without us? If yes, we can’t really claim to have leveraged the other capital; we were a useful contributor, but the deal was likely to happen anyway. Perhaps not immediately and perhaps at greater cost, inconvenience and uncertainty – but on the balance of probabilities, it would’ve gone ahead. But if the answer is no, then the other funders deploying alongside us are doing so at least partly because we did. That is the version of leverage we think it is worth measuring.
Across our three funds, we have made 62 commitments worth £18.8m, of which 57 worth £16.7m have been deployed at the time of writing. For each deal, our investment team made a judgement call: would this project have happened, within roughly a 12-month period, had Figurative not invested? There is no counterfactual data we can check this against. But the judgement is made by the people who saw the underlying business cases, knew which other funders had been approached, and watched the deal close (or not). We think it is a reasonable, informed approximation – and we have been deliberately conservative, recording a ‘no’ only where we feel comfortable making that claim.
In 33 of our 62 deals (53%), Figurative was the sole investor in the funding round. In the other 29, we sat alongside other capital – a mix of grant funding, debt financiers, social investors and other sources. That second group is the universe in which any leverage question is meaningful.
In 22 of our 62 deals (around 35% of the portfolio), the investment team judges that the project would not have proceeded without us. In additionality terms, these are cases where we genuinely added capital that would not otherwise have reached the borrower.
In 12 of those 22 deals, however, we were also the sole investor. The project happened, but no other capital was crowded in alongside ours. That is additionality without leverage.
That leaves 10 deals – 16% of the portfolio – where we judge ourselves to have been catalytic and where other funders invested alongside us. These are our cleanest examples of leverage in the sense we care about: deals where our capital plausibly pulled in additional money that would otherwise have been unlikely to reach the borrower.
Across those 10 deals, the average ratio of additional capital to ours is 1.64x – slightly better than a 1:1 match. The range is wide. At one end, the National Holocaust Centre and Museum, where our £200,000 sat alongside £1.175m of other funding (5.9x). At the other, an undisclosed regional theatre, where £600,000 from us appears alongside £100,000 from elsewhere (0.17x). In aggregate, £3.2m of our investment in these 10 deals sits alongside £5.1m of other capital.
What to make of this
A few reflections. First, the 1.64x figure is meaningfully lower than ratios that count total round size against own contribution. In that latter, broader case, the multiple jumps to 3.15x. We think the lower figure is more defensible. It draws a tighter circle around what we can plausibly take credit for.
Second, the catalytic argument and the leverage argument are different things, and the data quietly makes the case for both. In around a fifth of our portfolio (the 12 catalytic-sole-investor deals), we were the only funder willing to step in. No capital was crowded in, but the project happened. For a sector still being told repayable finance is too risky for arts organisations, demonstrating that we have been the first money (sometimes the only money!) matters at least as much as showing we have brought others along with us.
Third, the methodological caveat. The catalytic judgement is the team’s, not an external auditor’s. The question is framed as ‘would we have been easy to replace?’, and we have recorded ‘no’ sparingly. One of the 10 leverage deals is also a commitment that did not ultimately draw down – so strictly speaking the demonstrated crowd-in across deployed deals is closer to nine. None of this is gospel. It is a reasonable, informed approximation from the people closest to each deal, offered in the spirit of honest portfolio reflection rather than headline marketing.
For more on how arts organisations use impact investment in practice, see our April 2025 blog and the case studies in our portfolio. Find out more about the Arts & Culture Impact Fund, our open fund providing loans of £150k–£1m to socially driven arts, culture and heritage organisations across the UK.
*Figures correct as of July 2026.
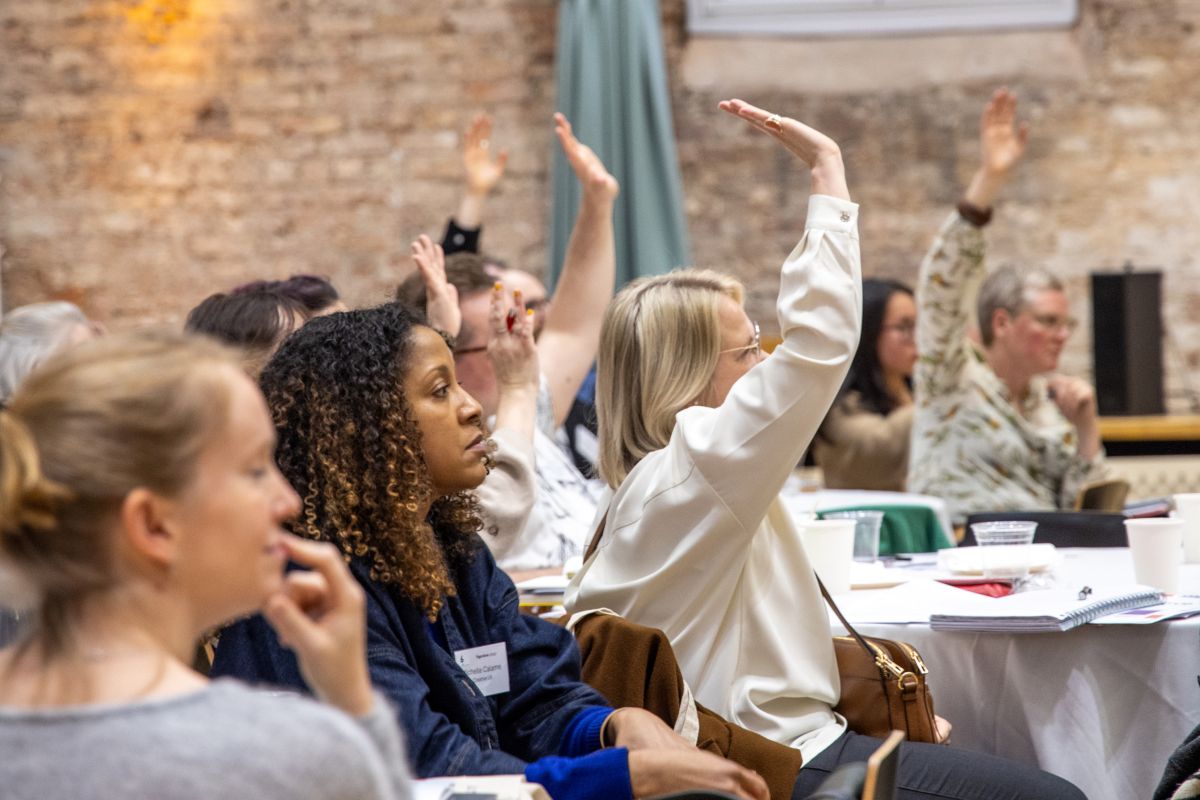
On 23 July, around 20 practitioners working to finance culture and creativity around the world met to compare two very different approaches to lending in the cultural and creative sectors.
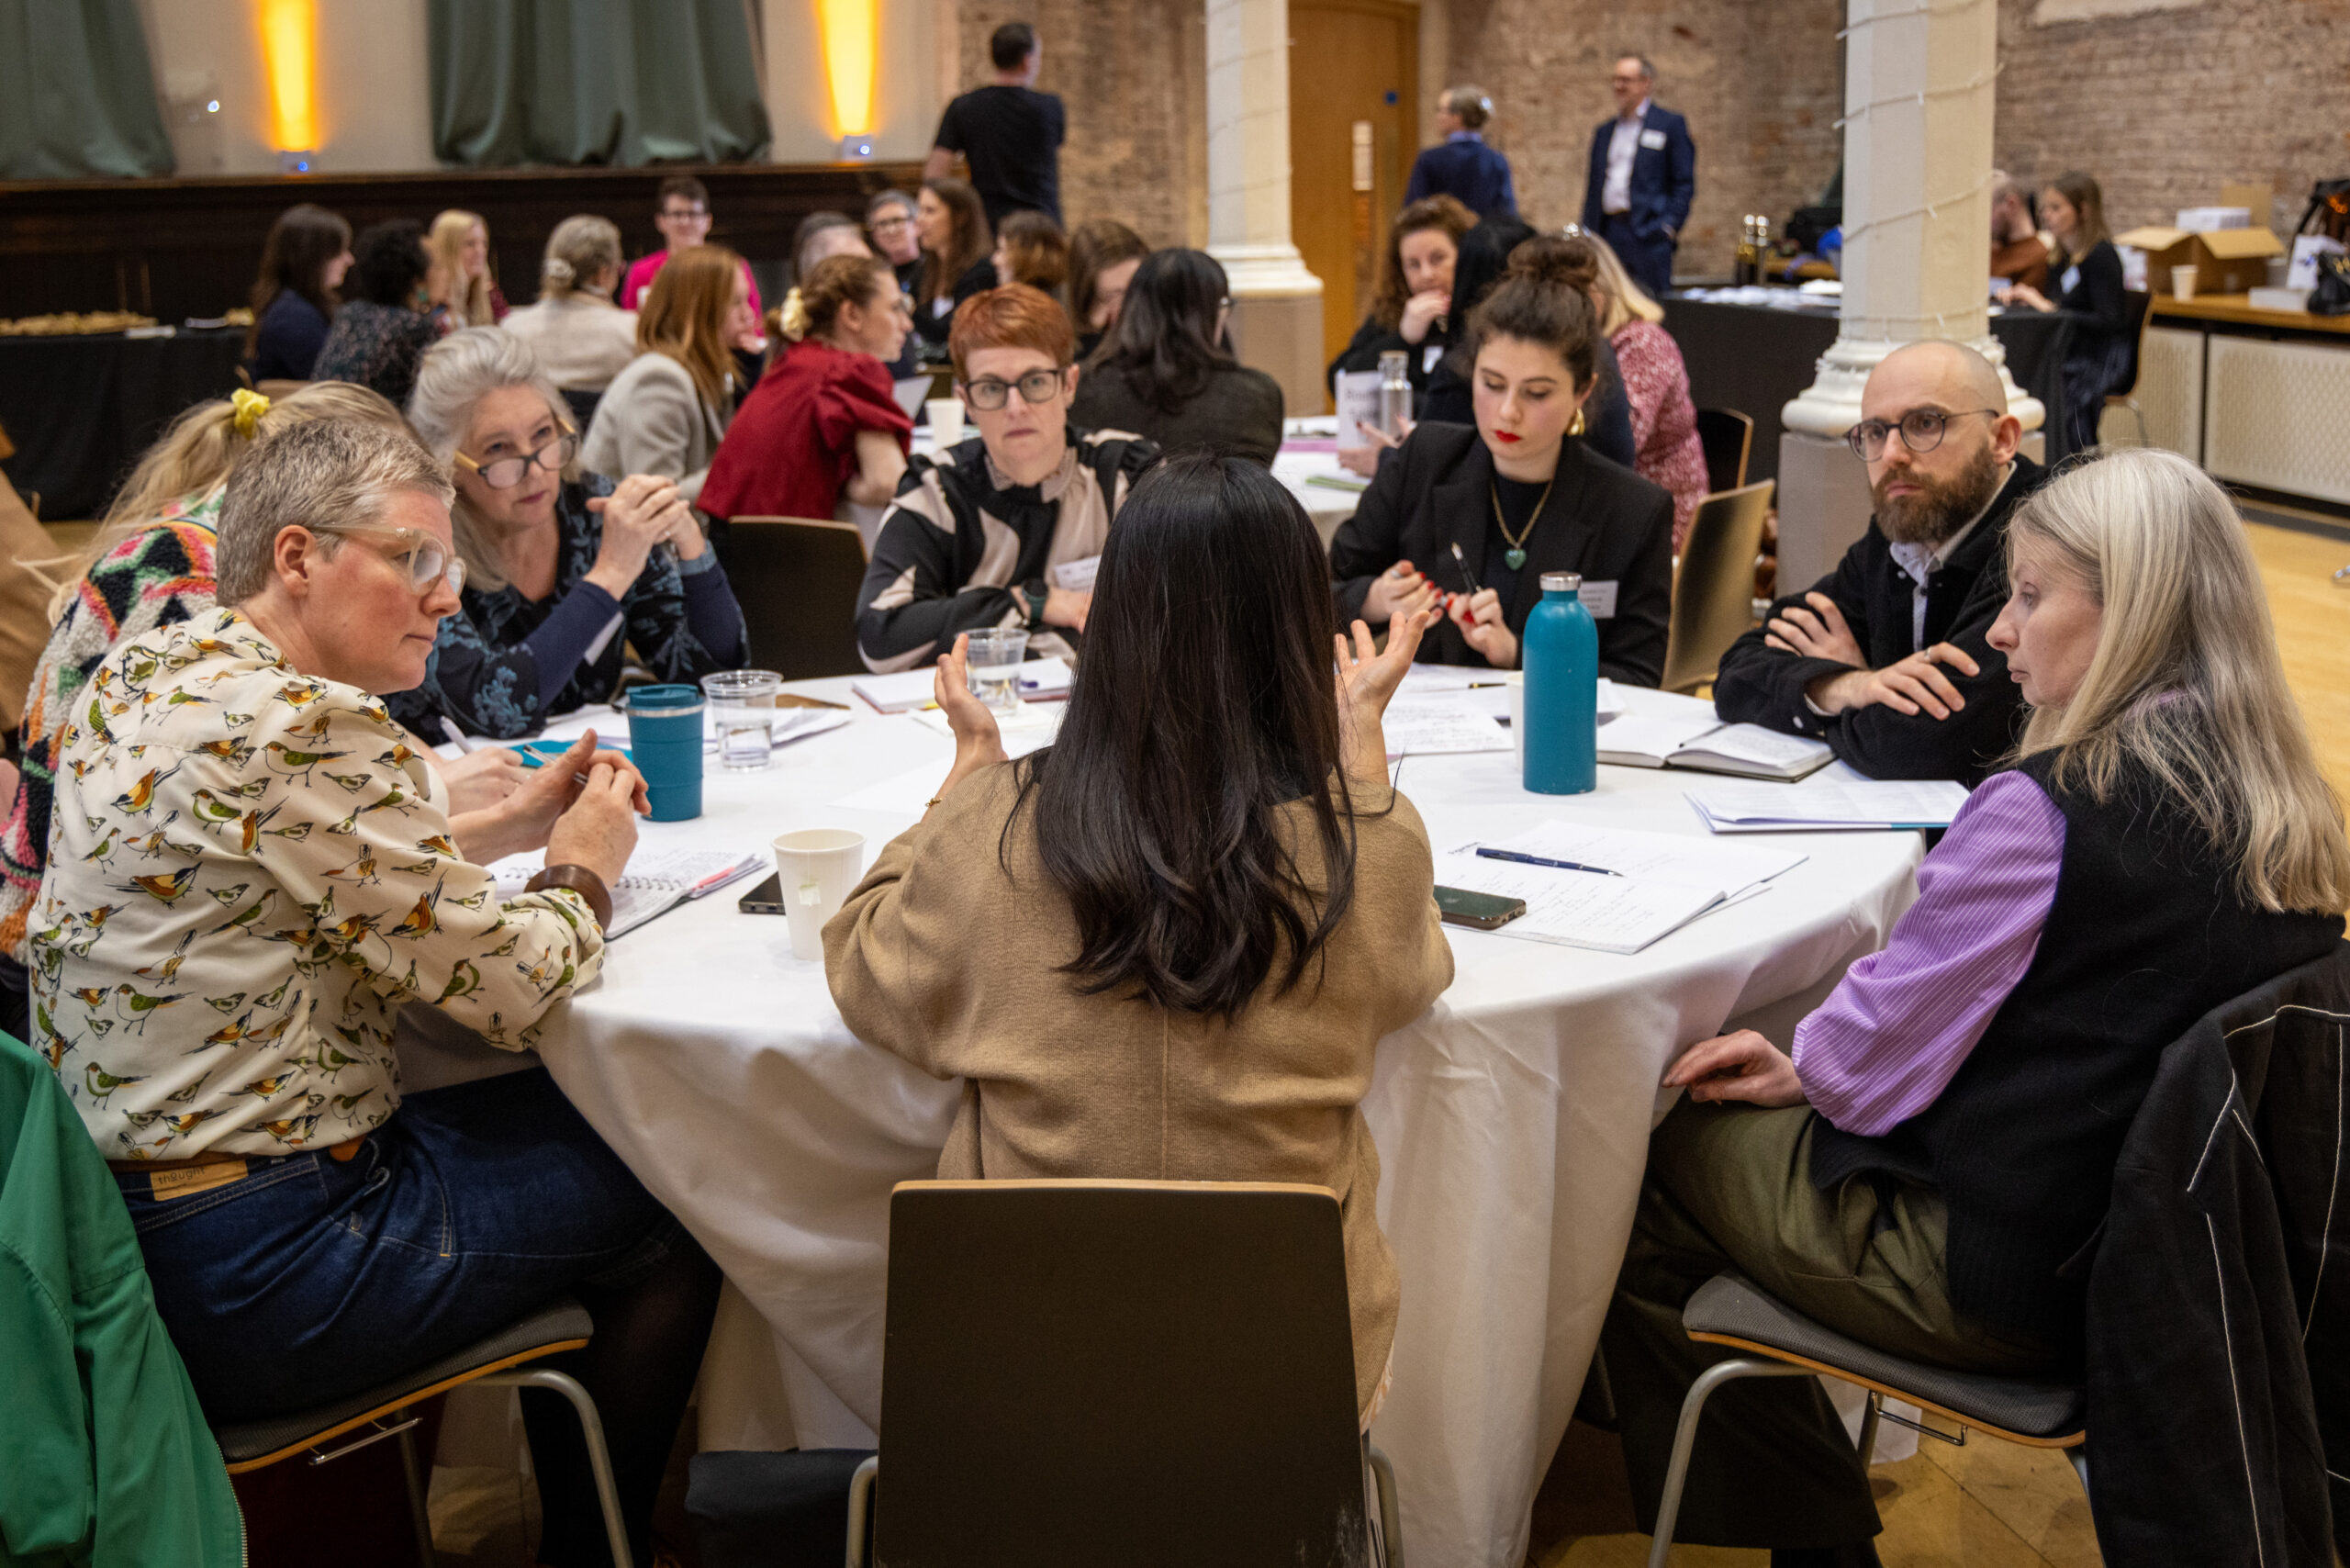
On 2 July, around 20 practitioners working to fund culture and creativity around the world met to discuss the strengths and challenges of impact measurement and outcomes-based funding models.
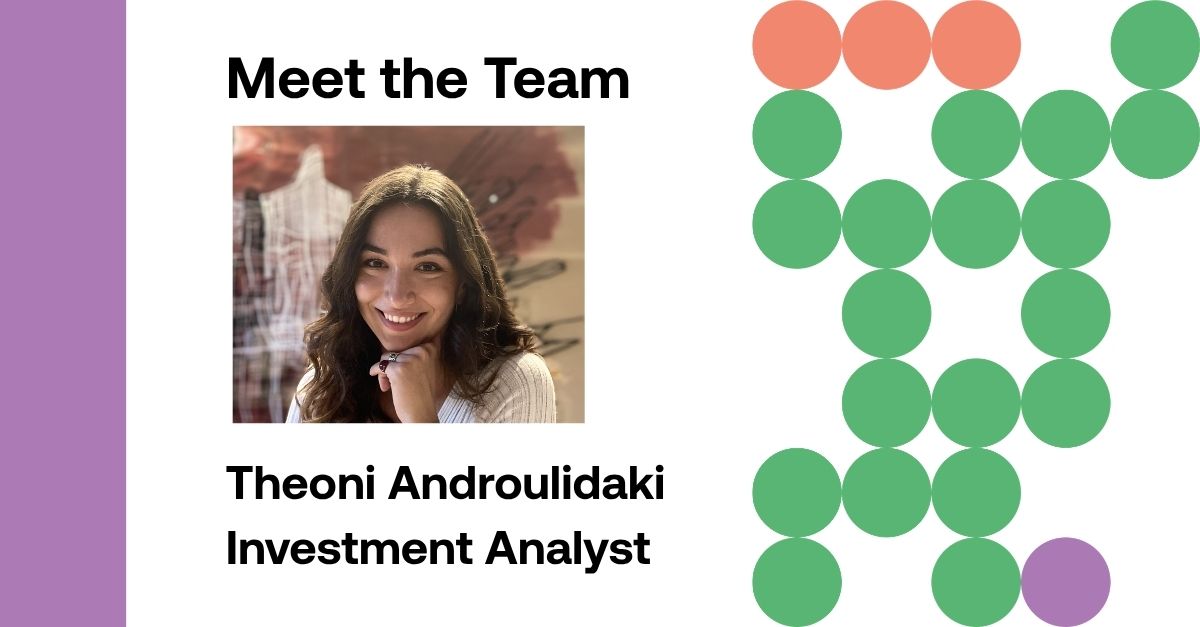
In the second of our new Meet the Team series, we meet Theoni Androulidaki, Figurative's Investment Analyst, to learn about her background and work.
Seva Phillips introduces a new series encouraging candid conversations between practitioners financing culture in different parts of the world.