Theatre Tax Relief Cashflow Loans
We offer loans to support non-profit theatres waiting for Theatre Tax Relief claims to be paid – so you can focus on strategic objectives rather than short-term cash management.
We offer loans to support non-profit theatres waiting for Theatre Tax Relief claims to be paid – so you can focus on strategic objectives rather than short-term cash management.

Image credits:
Photo by John Matychuk on Unsplash.
Since launching the Arts Impact Fund in 2015, we've been tracking whether affordable, flexible repayable finance can help arts organisations become more resilient. Here's what we've learnt so far.
Financial resilience is one of those concepts everybody talks about, but nobody quite agrees on how to define, let alone measure. For arts and culture organisations, where margins are thin, public funding is shrinking, costs are climbing and earned income can vanish overnight (as the pandemic demonstrated with brutal clarity), the question has a particular edge.
At Figurative, we’ve been grappling with this practically for over a decade. Our first fund, the Arts Impact Fund (AIF), launched in 2015 as the world’s first impact investment fund dedicated to arts and culture, testing whether affordable, flexible repayable finance could help arts organisations become more financially resilient. AIF made 27 investments totalling over £8m, of which five loans remain outstanding.
In 2022, our colleague Rachel Green produced an academic study examining whether AIF borrowers’ financial resilience had improved following receipt of a loan. Her research used nine financial metrics drawn from each organisation’s accounts, comparing averages before and after the loan.
We’ve now updated that data – extending the post-loan period and incorporating more recent financial information – to see how things have changed.
Before getting into the numbers, a word on why these particular metrics. Financial resilience in the cultural sector has no universally agreed definition. The literature oscillates between income, balance sheet strength, management capability, or some combination of all three. We’ve cast a wide net, selecting indicators that capture both an organisation’s profit and loss trajectory and its underlying financial position — deliberately kept simple, because data quality for smaller arts organisations often doesn’t support more complex ratios.
| Metric | What it tells us |
|---|---|
| Gross income | Overall scale of activity |
| Earned income |
Income from trading, as distinct from grants
|
| % earned income | Proportion of income that is self-generated |
| Number of income sources | Diversity of the funding base |
| Surplus/deficit | Whether the organisation is generating or consuming resources |
| Fixed assets | Assets available to support activities (often property) |
| Net current assets | Short-term viability — can the organisation pay its bills? |
| Net assets | Overall financial position, taking all assets and liabilities into account |
| Cash reserves | Buffer available to weather a downturn |
For each metric, we looked at a straightforward question: what proportion of the portfolio saw an improvement in the post-loan period compared with the pre-loan period?
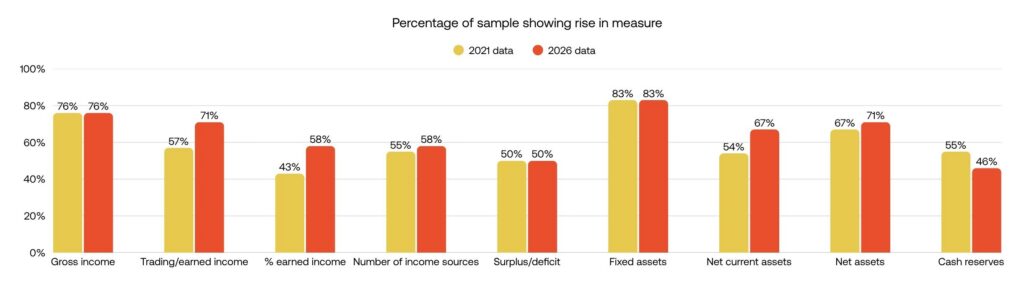
The headline is that the picture has broadly improved since 2022. Earned income – badly hit during the pandemic when trading ceased – has seen a notable recovery, up from 57% to 71%. Net current assets jumped from 54% to 67%, and net assets from 67% to 71%. Fixed assets remain the standout at 83%, unchanged but consistently the strongest metric.
The one metric where the trend has gone the other way is cash reserves, down from 55% to 50%. This is perhaps the most telling indicator of the current environment. After weathering the pandemic, many arts organisations have been contending with inflationary pressures, rising operating costs, and audiences slow to return. Reserves have been drawn down, and rebuilding them remains a work in progress.
We should be clear-eyed about the limitations. This is one portfolio of 25 organisations*, varying in size, subsector and legal structure — small enough that outliers can meaningfully influence averages. There is no counterfactual: without a matched control group, we can’t definitively attribute improvements to the AIF investment as opposed to broader sectoral trends or other funding. Data quality remains imperfect, and the post-loan period is still, for many borrowers, shorter than the pre-loan baseline.
We share this because transparency matters more than tidy narratives. We will continue to build this dataset, incorporating data from our two other funds – the Cultural Impact Development Fund and the Arts & Culture Impact Fund – as those portfolios mature.
We believe the sector needs a franker conversation about what financial resilience actually looks like in practice for cultural organisations — not as an abstract policy objective, but as something that can be tracked, discussed, and improved. To understand how investment has been used in practice, take a look at our case studies.
We hope this can be the start of a more lively exchange.
*Although 27 investments were made, we have data only for 25.
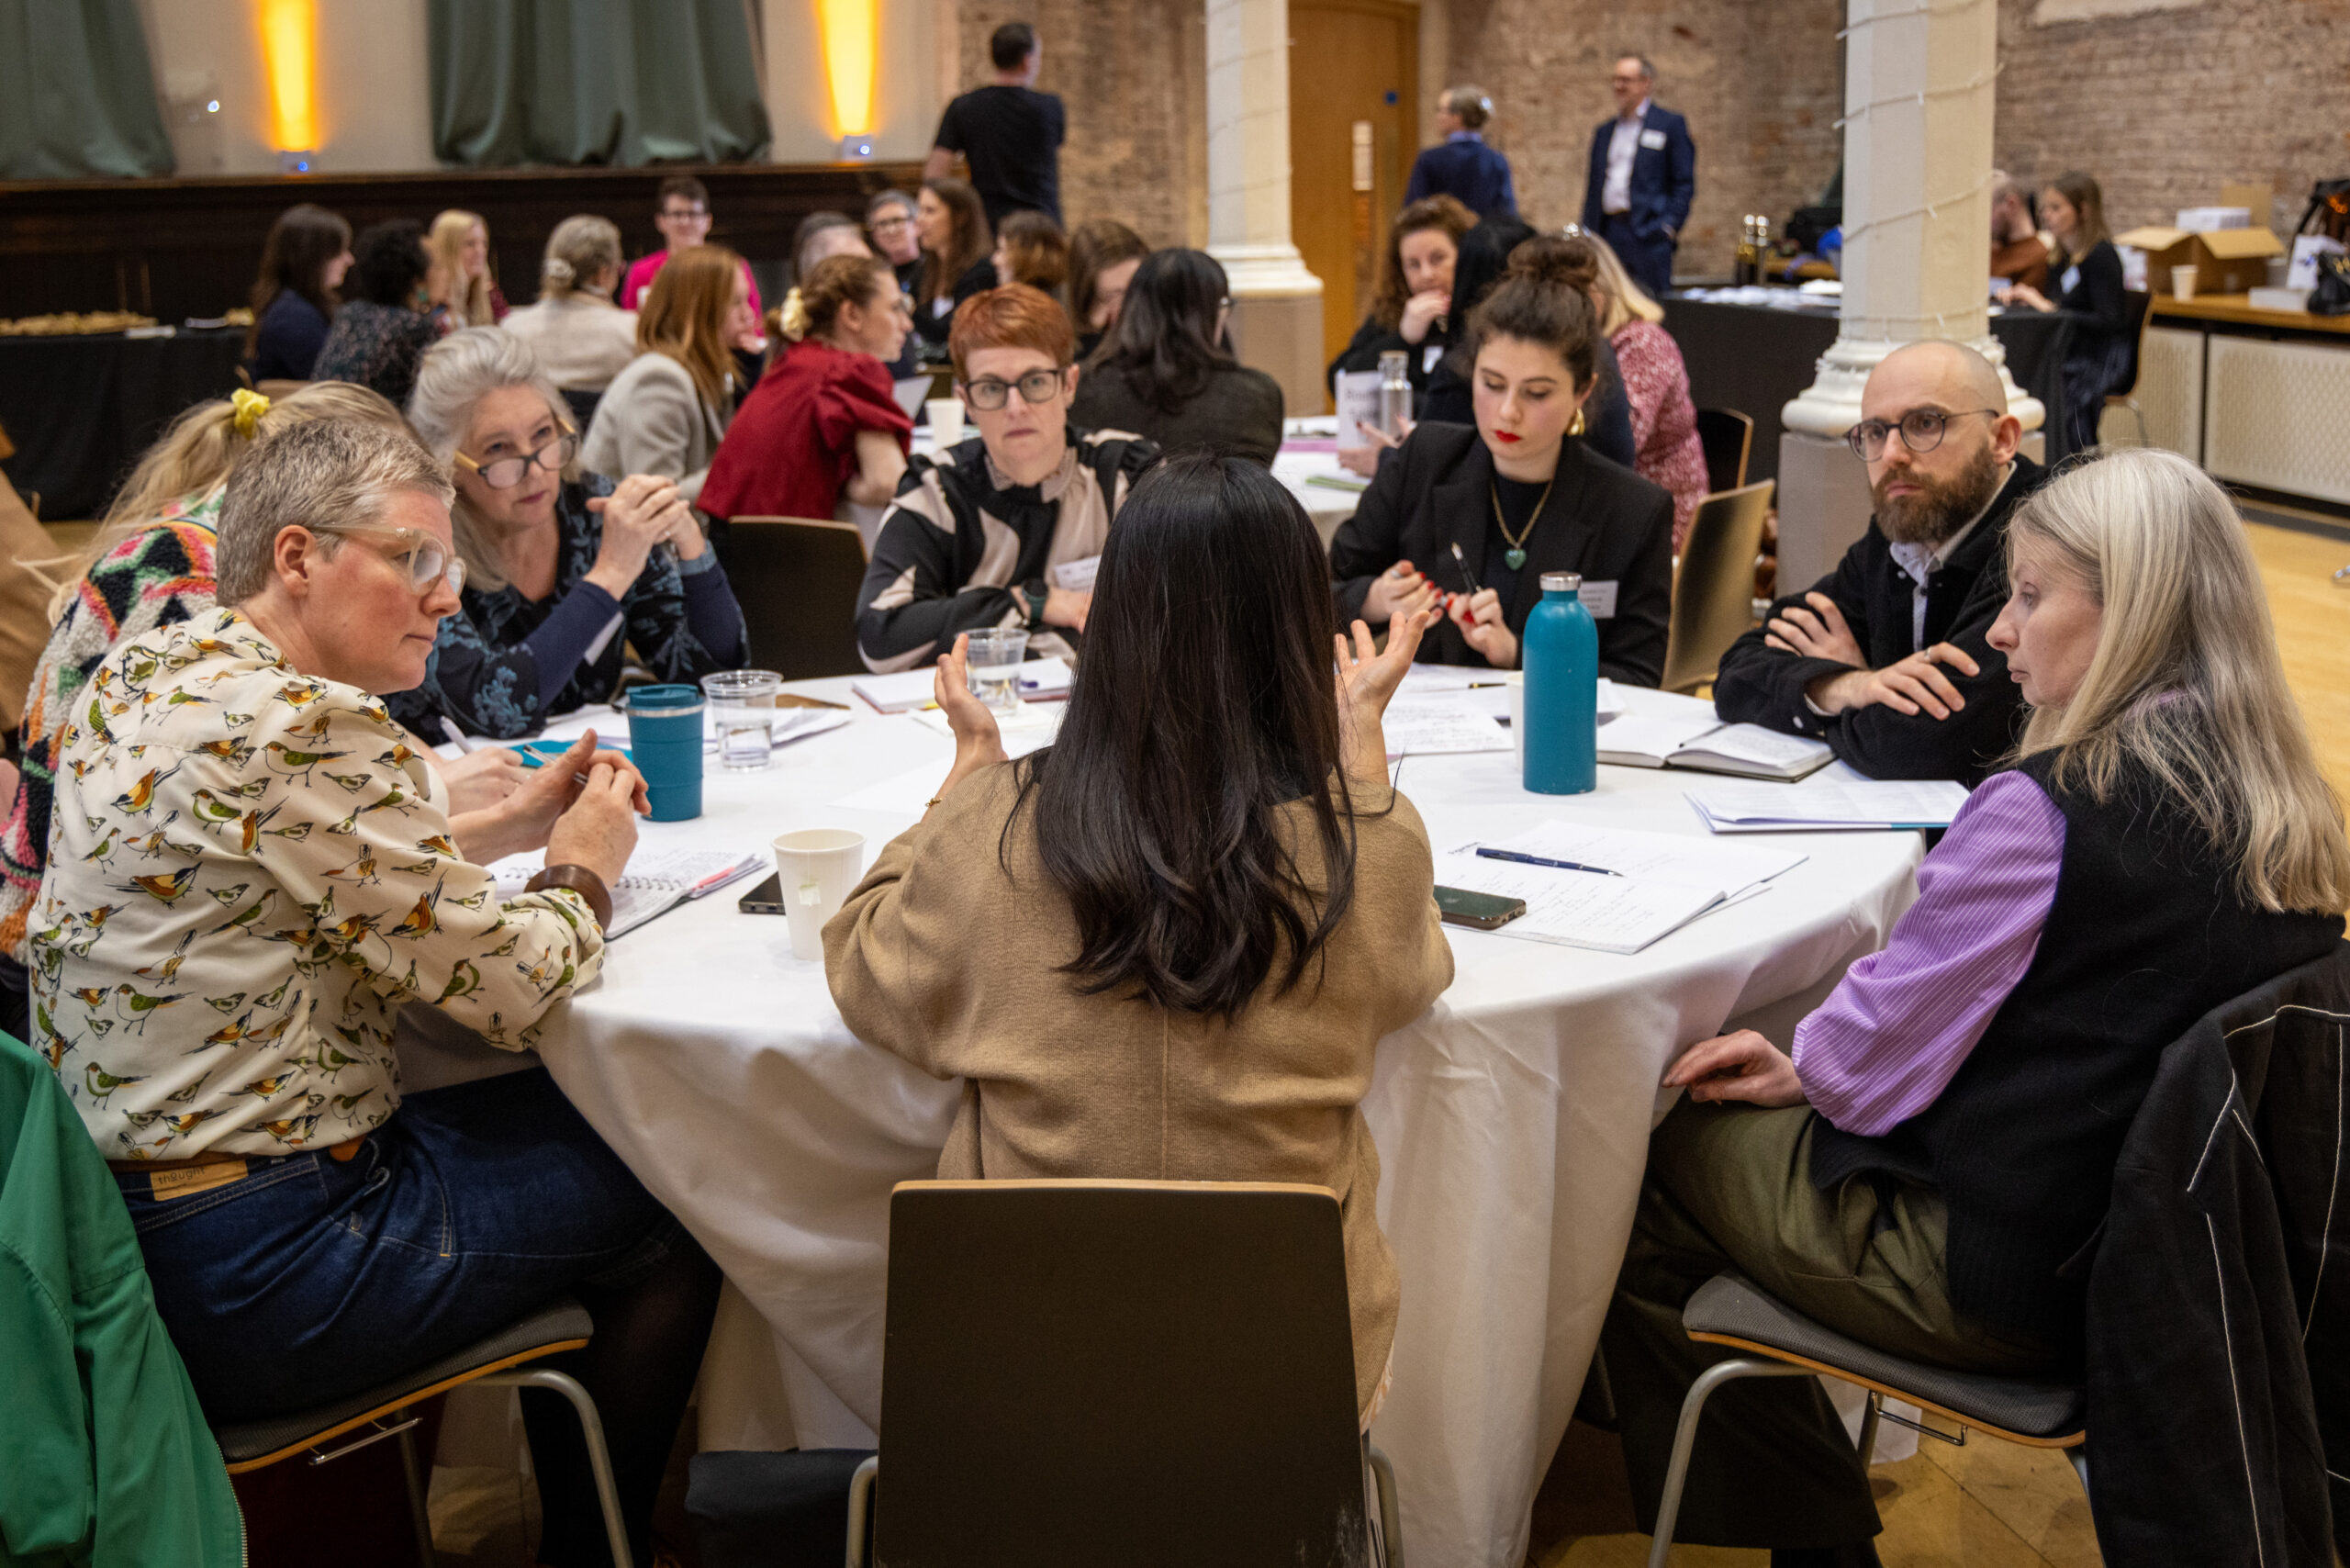
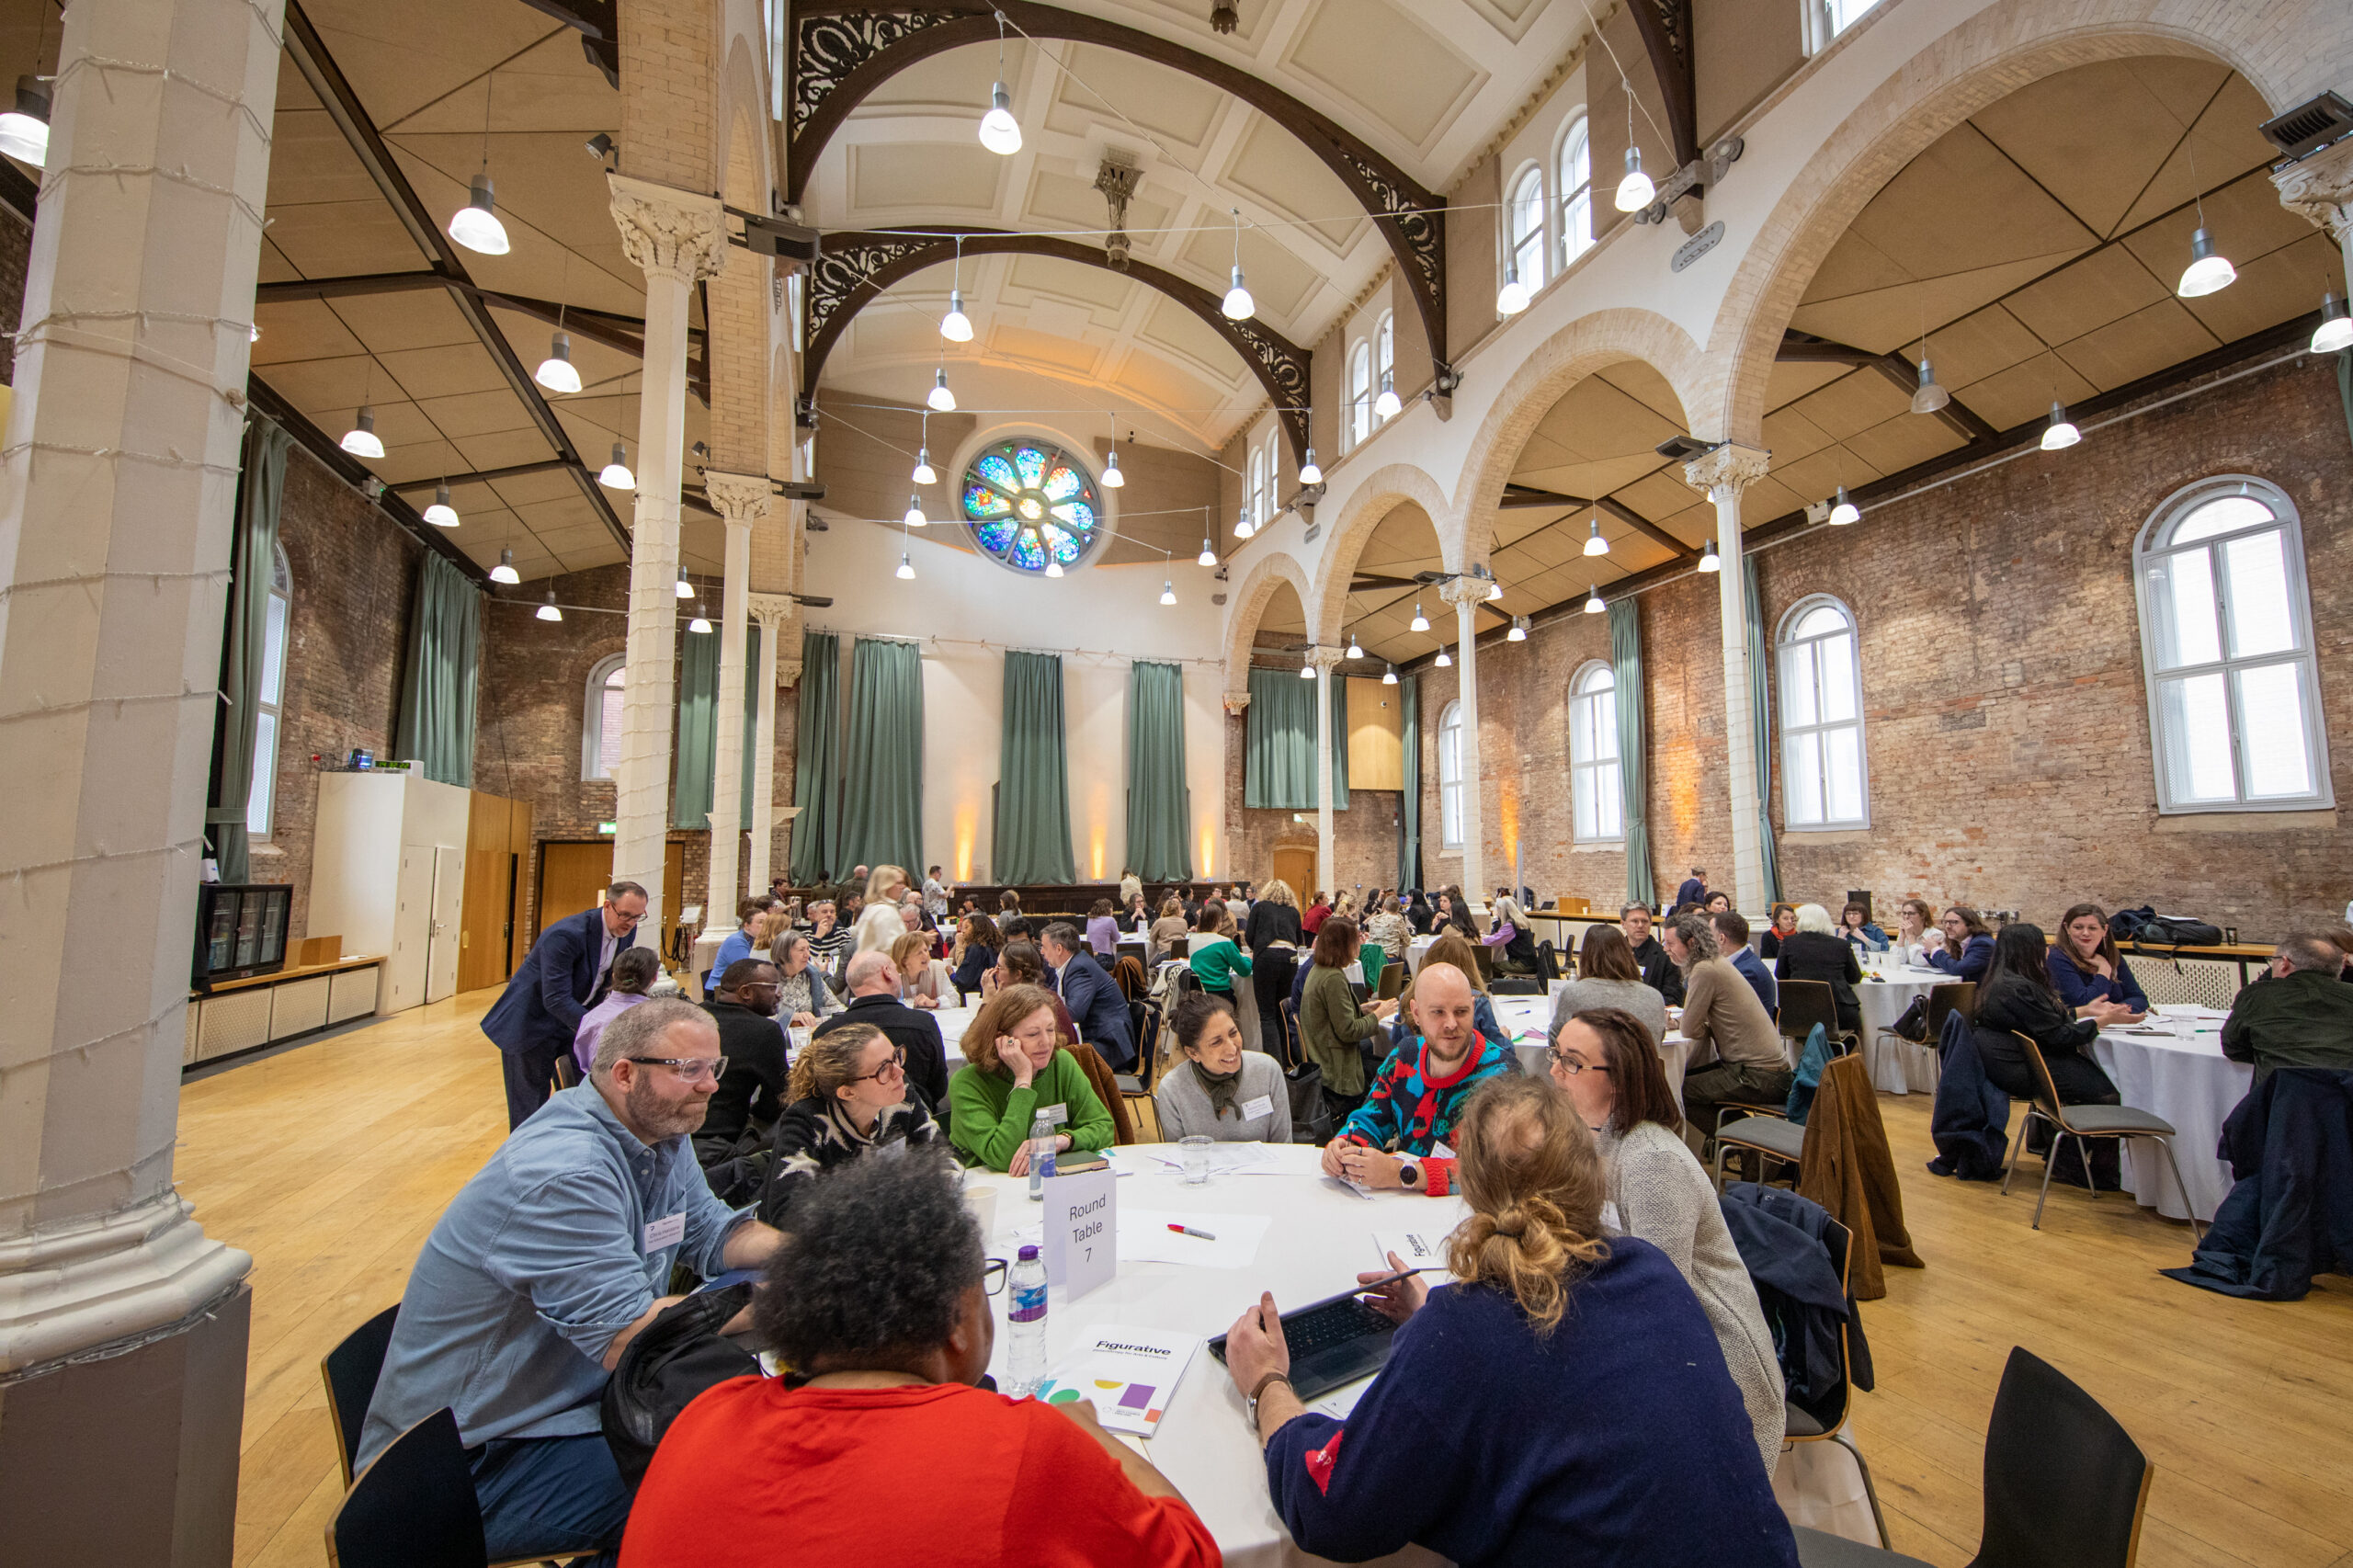
On 2 July, around 20 practitioners working to fund culture and creativity around the world met to discuss the strengths and challenges of impact measurement and outcomes-based funding models.
In the second of our new Meet the Team series, we meet Theoni Androulidaki, Figurative's Investment Analyst, to learn about her background and work.
Seva Phillips introduces a new series encouraging candid conversations between practitioners financing culture in different parts of the world.

Repayable finance is sometimes characterised as a tool for organisations in distress, but the dominant story across our portfolio is one of growth and strategic ambition rather than survival.